A task is one unit of work ending in one pull request. It is what actually executes — plans, sprints and lanes are ways of organising tasks.
The header
A row of chips summarises the task at a glance: its project, its type,
the AI profile running it, and the QA checks applied — shown as the
policy name, where it came from, and its version, for example
Standard · From plan · Organisation policy · v6.
A padlock on the AI profile means it is fixed and cannot be changed now. The resolved QA policy is likewise pinned when execution begins, so changing the organization policy later does not retroactively alter work already running.
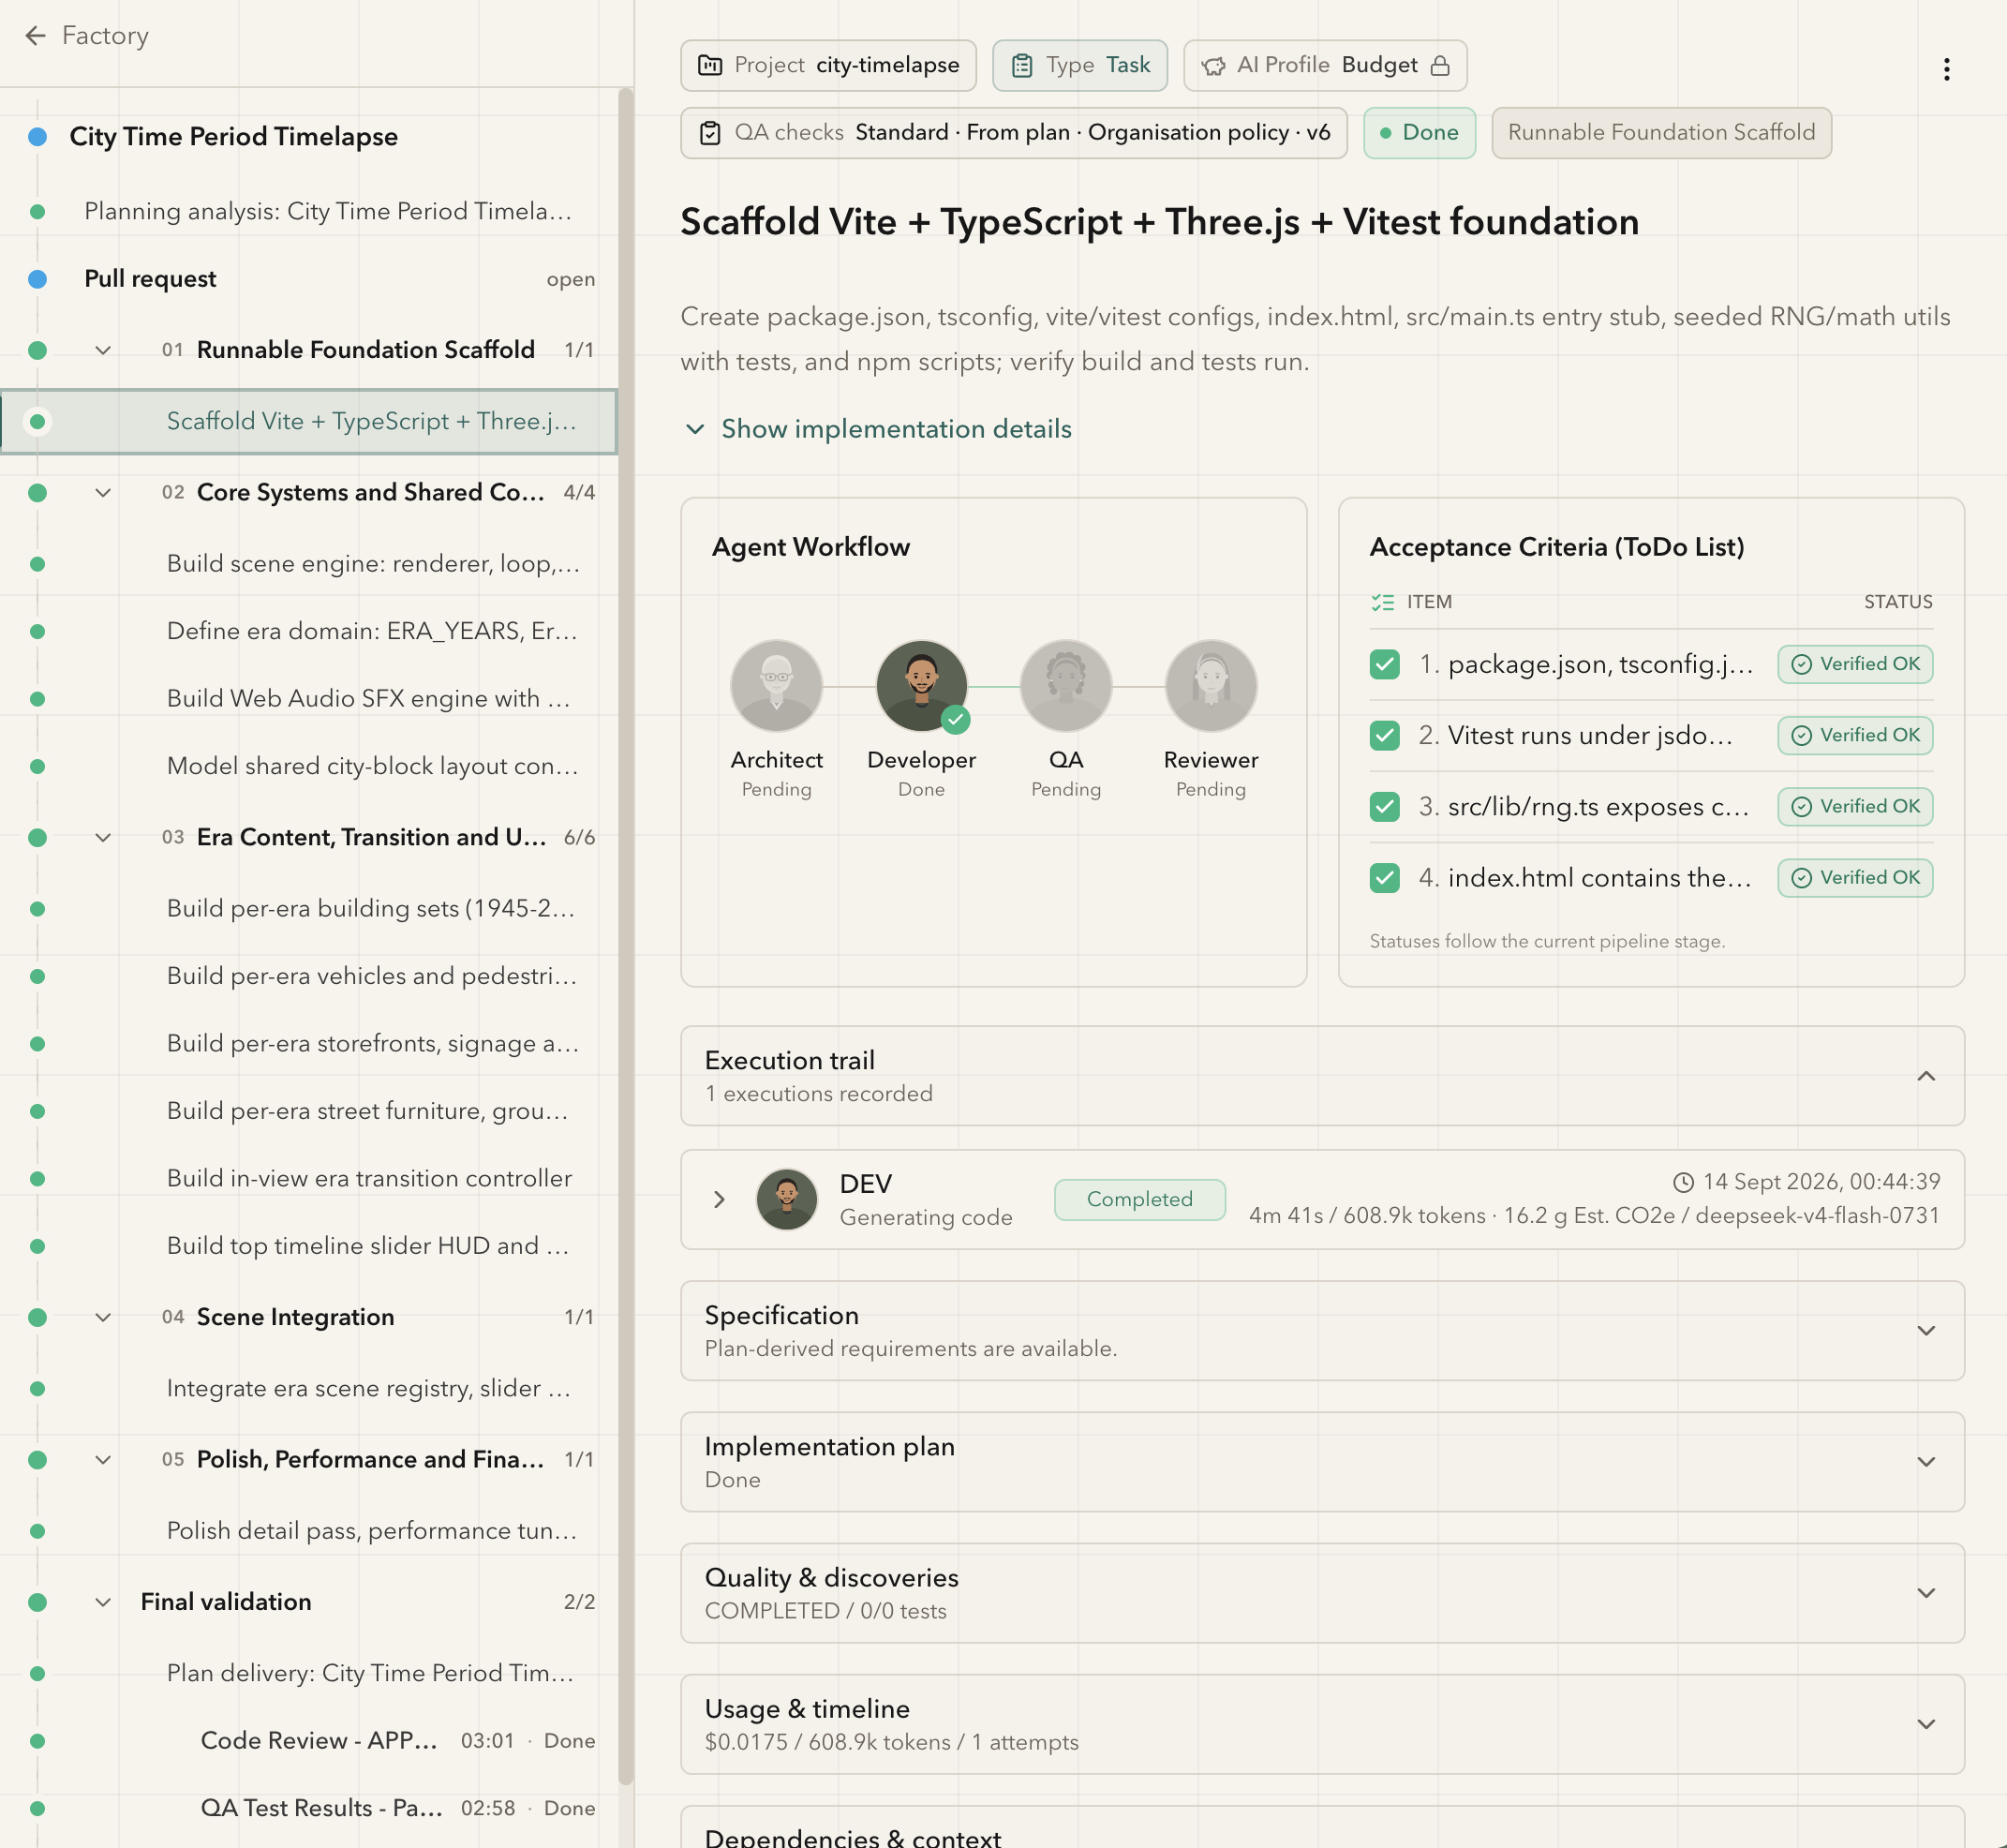
Agent workflow
Four agents run in sequence, each showing its own state — pending, running or done:
Architect → Developer → QA → Reviewer
 Architect
 Developer
 QA
QA Reviewer
This is the clearest answer to "where is this task?". A task showing Developer done and QA pending is waiting to be verified, not stalled.
Note that a stage can legitimately show Pending even on a finished task — tasks generated from a plan already have their specification and implementation plan, so the Architect stage has nothing left to do.
See Agent roles for what each may and may not do.
Acceptance criteria
The criteria from the specification, as a
checklist with a status against each — Verified OK when a criterion has been
confirmed.
Statuses follow the current pipeline stage, so criteria are verified as the task progresses rather than all at the end.
This panel is the thing to read when judging a finished task. It tells you what was promised and what was actually confirmed, which is a sharper question than whether the tests passed.
Execution trail
Every execution recorded against the task. Each entry shows the agent, what it was doing, its result, and the cost:
DEV · Generating code · Completed
4m 41s / 608.9k tokens · 16.2 g Est. CO2e / deepseek-v4-flash-0731
Duration, token usage, estimated carbon and the exact model are all recorded per execution — so when a task costs more than expected, you can see which stage and which model accounted for it.
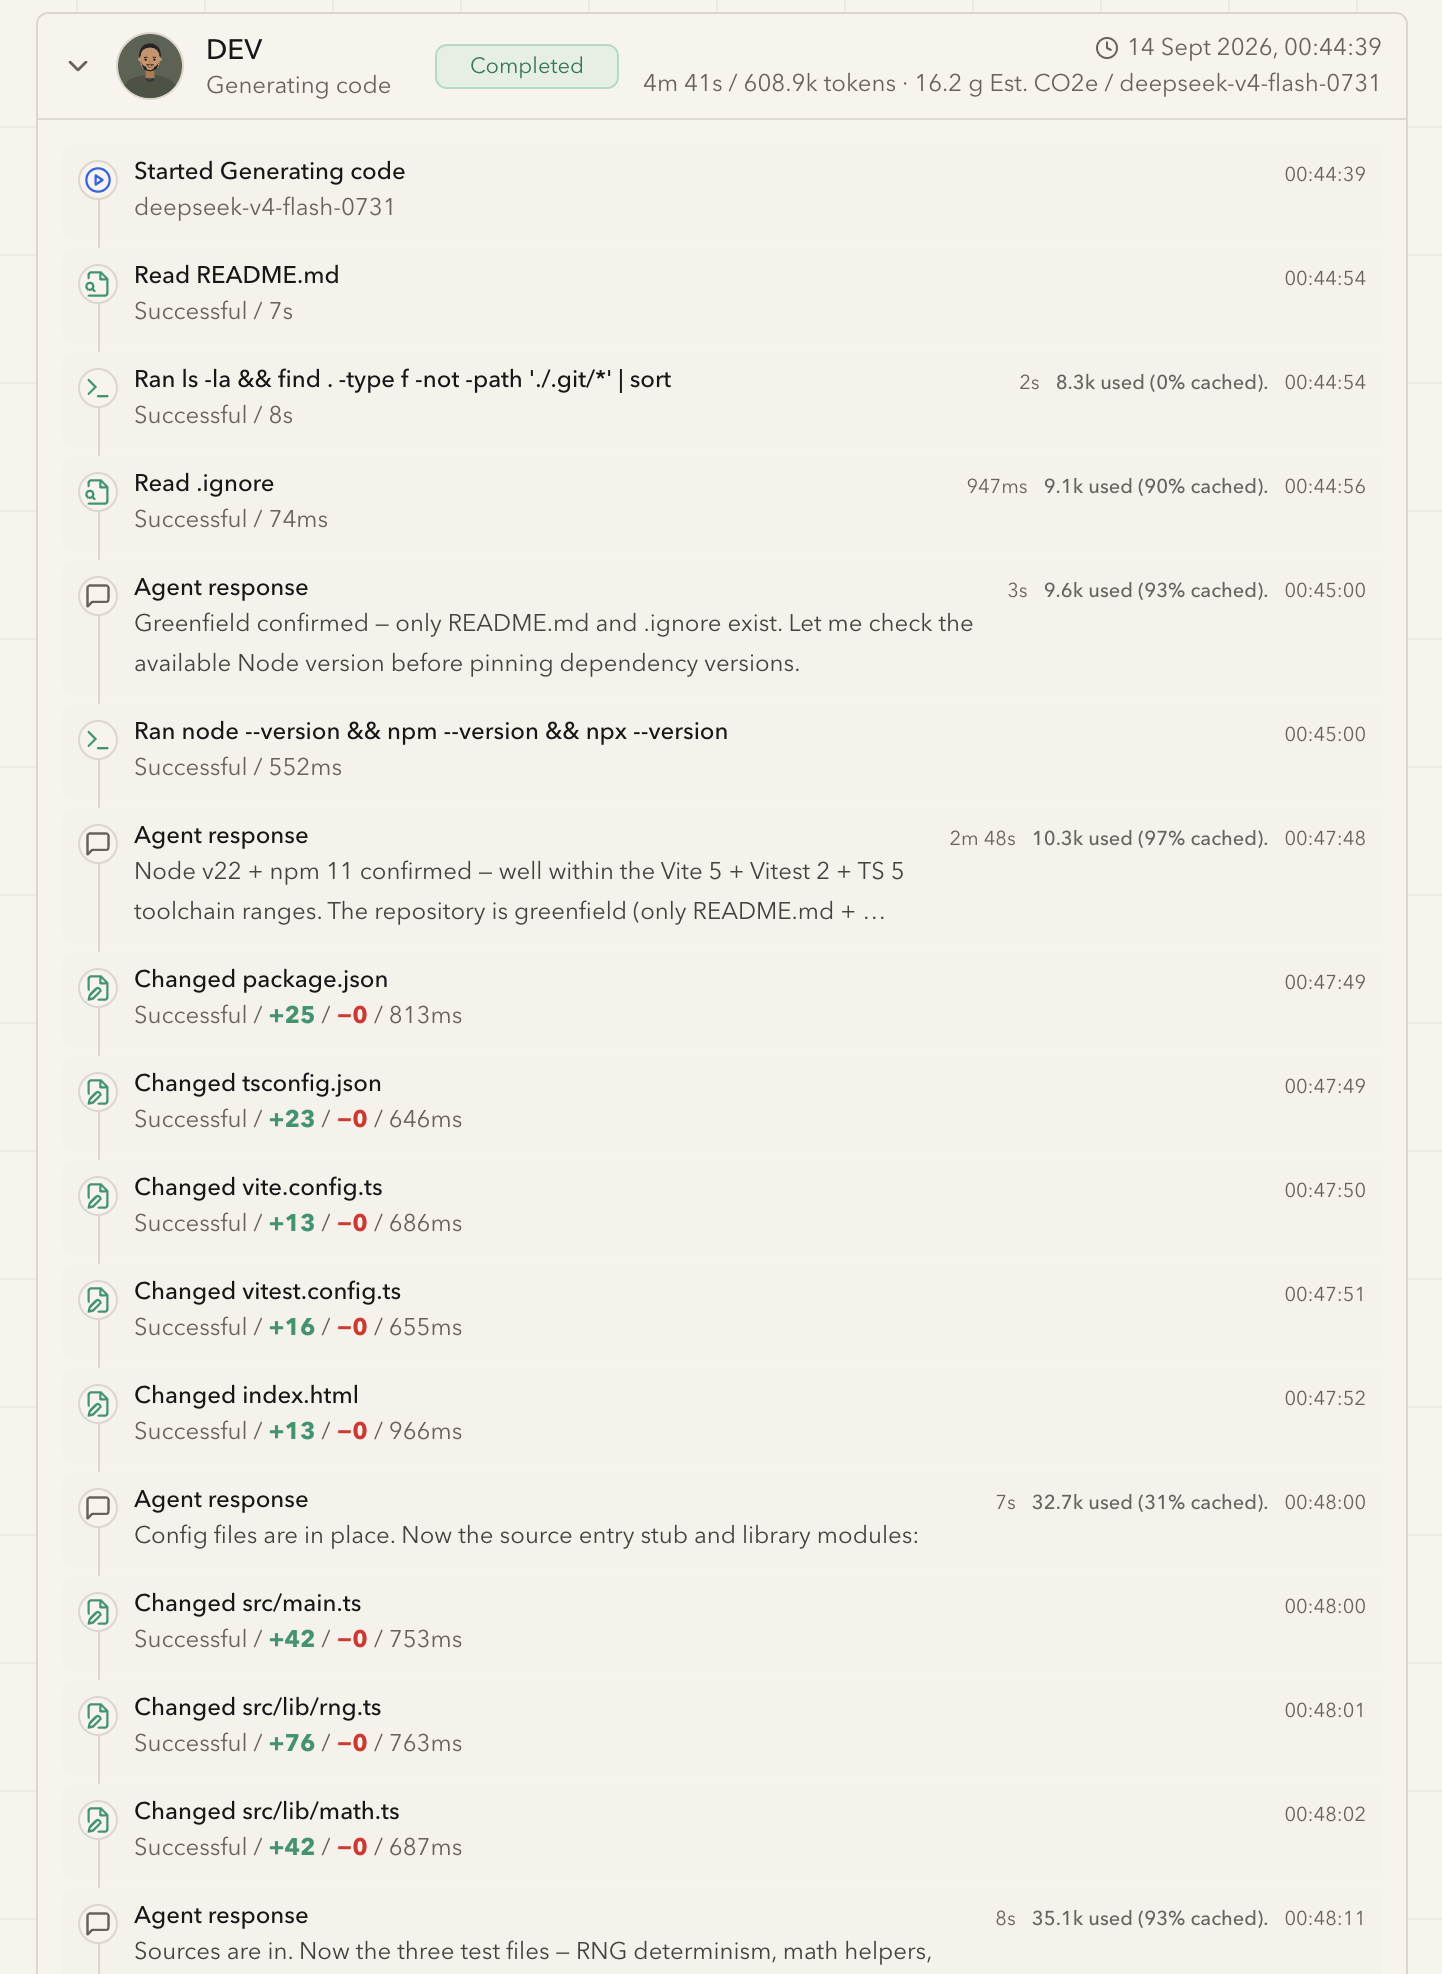
Expanding an execution gives the full step-by-step trail: files read, commands
run, agent reasoning, and every file changed with its line counts
(+25 / −0). Token entries show cache efficiency (9.1k used (90% cached)),
which is usually the difference between an expensive run and a cheap one.
This is the view to open when you want to know how something was done rather than just what changed.
The remaining sections
| Section | Shows |
|---|---|
| Specification | The plan-derived requirements |
| Implementation plan | The steps, and whether they are done |
| Quality & discoveries | Verification state and test counts |
| Usage & timeline | Cost, tokens and attempt count |
| Dependencies & context | Linked dependencies with their own statuses |
Usage & timeline reports attempts as well as cost — 1 attempts means it
succeeded first time. A higher number means rework, which is the single most
useful signal about specification quality.
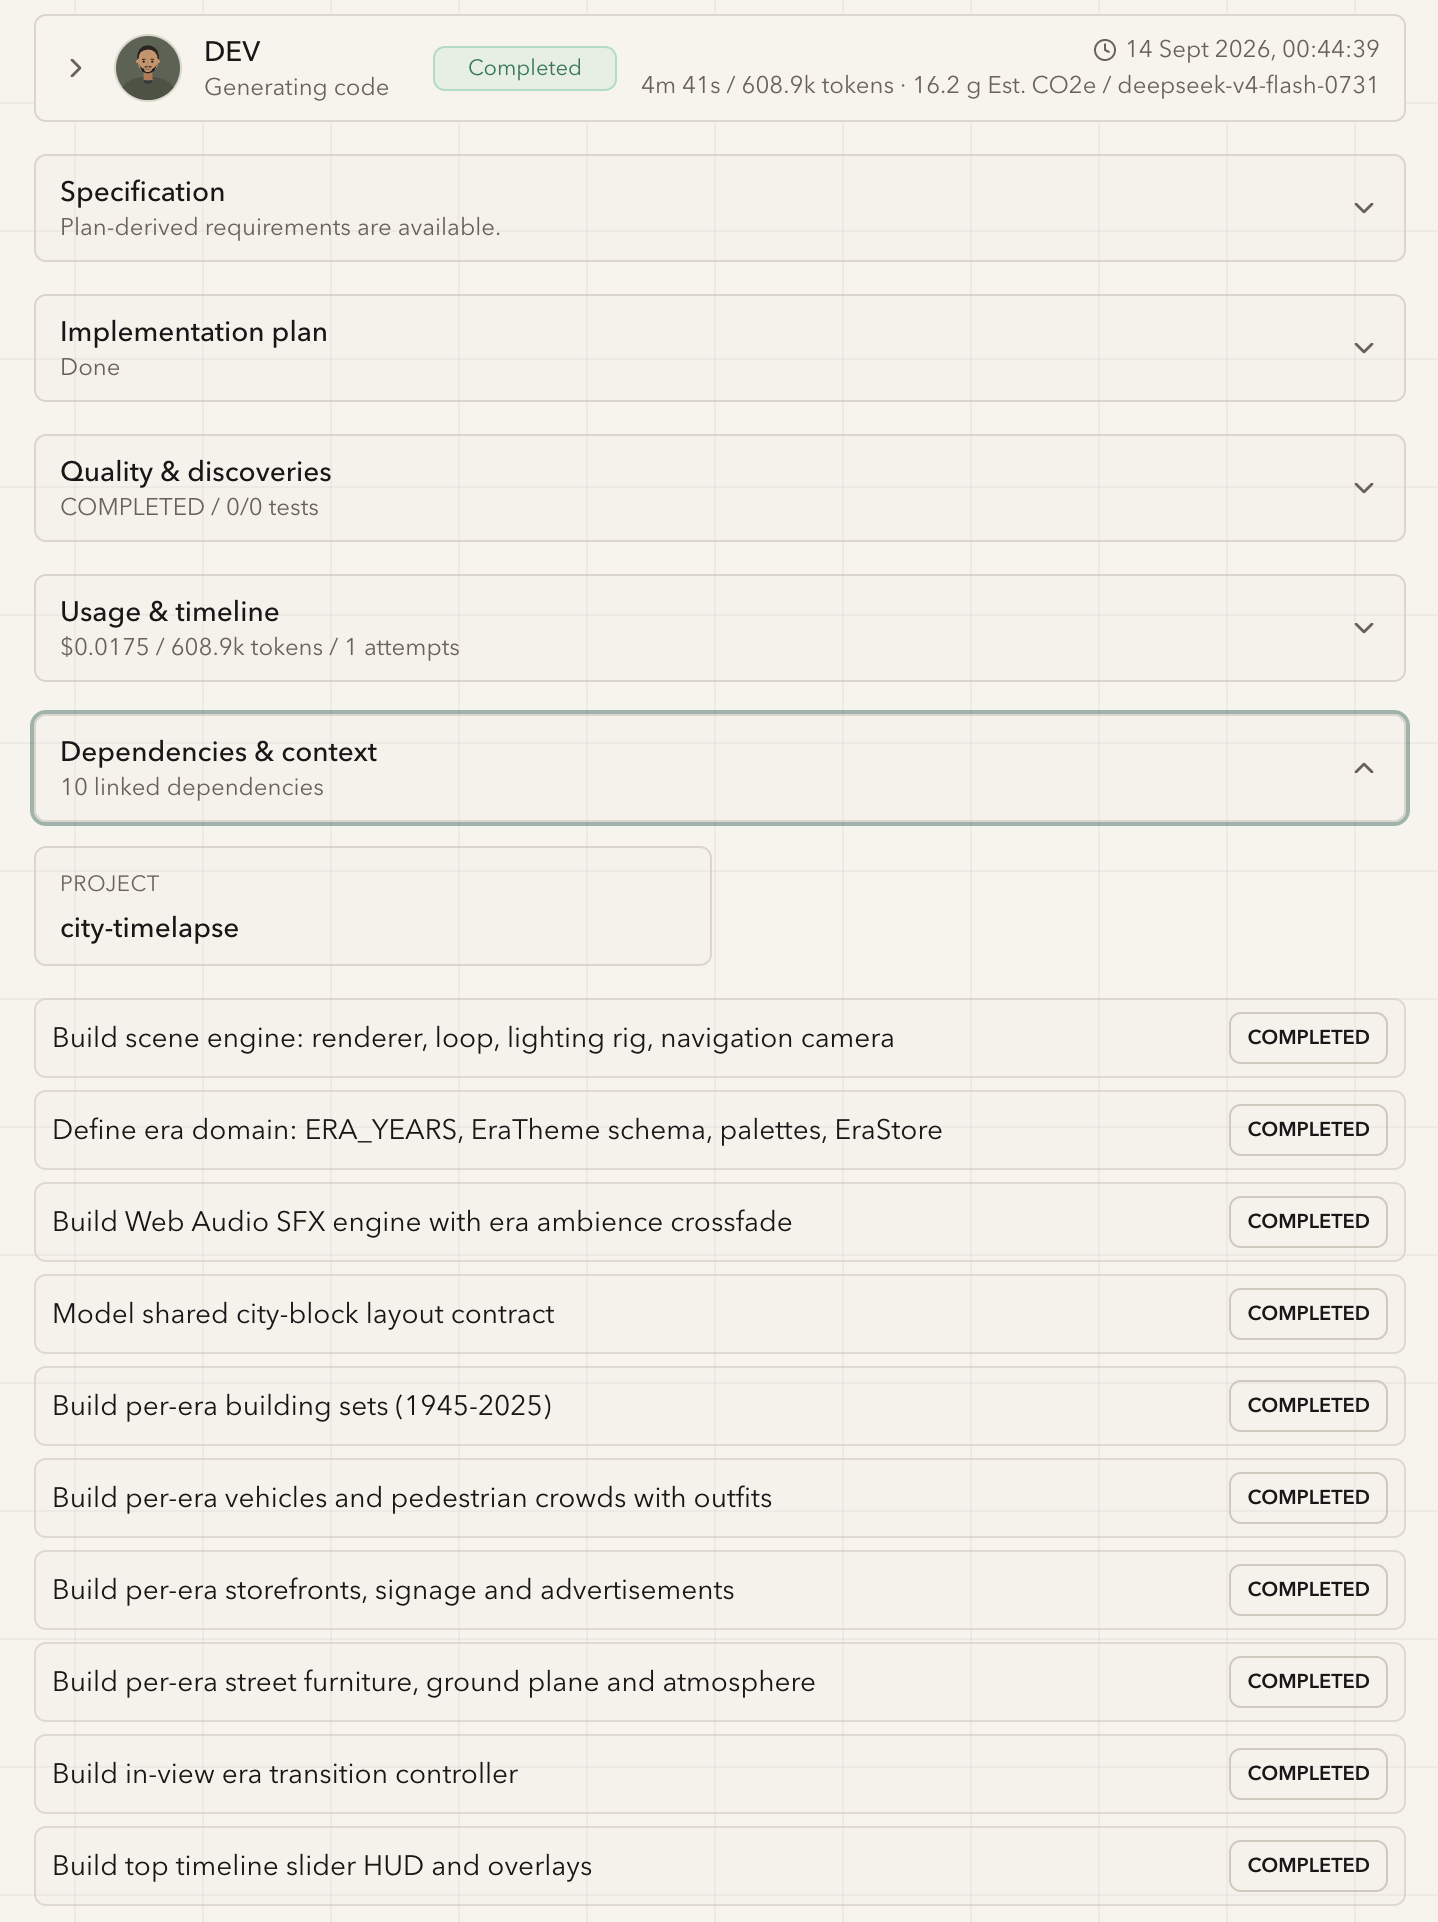
Dependencies & context lists the project and every linked dependency with its status. This is how you tell whether a task is waiting on something else or genuinely blocked.
Priority
Tasks carry P0 (highest) through P3, defaulting to P2. Priority orders the
queue when more tasks are waiting than there are free slots.
It does not add capacity. If everything is P0, nothing is — see
Capacity and agent slots.
Statuses
Every task status and what to do about it is in Task statuses. The two worth knowing here:
PENDINGis not stuck. It is queued, waiting for a slot.NEEDS_HUMAN_REVIEWis not a failure. It is a question. Answer it and the task continues.
Intervening
While a task runs you can pause it, cancel it, or send it back with comments as rework. For which to choose, see When a task gets stuck or fails.